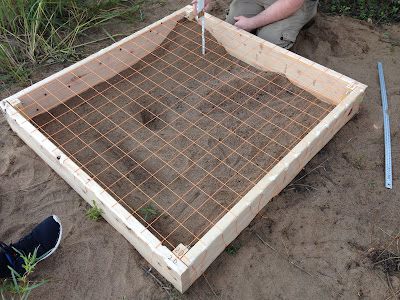
The class was presented with the assignment of creating an elevation surface of their choosing. This assignment had multiple objectives. These objectives included teaching the students how to collect their own data and import it into the computer as well as how to complete an assignment with limited direction. The students were divided into groups of three and equipped with string, meter sticks, marking flags and a homemade sandbox. The sandbox was used as the study area where the terrain analysis was conducted. Each group had to come up with their own coordinate system that they felt would accurately represent the terrain they had created.
Study Area:
The study area for this assignment was in Eau Claire, WI, specifically on the University of Wisconsin - Eau Claire Campus. The Chippewa River flows through campus and a sandy flood plain is located on the north side of the river under the student walking bridge. This flood plain is where each group created their specific terrain within the sandbox.
Methods:
The first objective each team needed to complete was choosing a site on the sandy flood plain of the Chippewa River. Once a site was selected, each group made their own terrain within the sandbox. The only landscape features needed within the sandbox were a ridge, valley, hill, plain and depression. After the terrain was made, our group had to decide how to effectively show all of our terrain features.
The sandbox used was not a perfect square. Our group modified the inside of the sandbox to allow for an even grid, to hopefully create a more accurate model. The inside measured 112 cm wide by 120 cm long. A grid square was created every 8 cm. Figure 1 (shown below) shows the grid lines dividing the sandbox.
 |
| Figure 1. This shows the grid lines across the study area. Each grid line was spaced out 8 cm apart from one another. |
One obstacle each group had to over come was deciding where to create their base height. Our group decided that the top side of the sandbox was going to be measured as the base height, or the point of zero elevation. The next step was to measure the height of each grid square. Figure 2 (shown below) shows how the group measured the elevation. In order to keep data consistency, we collected heights from the southeast corner of each grid square. This allowed for for even spacing between measurements.
 |
| Figure 2. This shows the method of measurement that was used to determine the height of each grid. |
Once all the heights were recorded, our group transferred the data onto an excel spreadsheet. There were 210 points all together. Since none of our terrain features were taller than the sandbox edges, we recorded all negative values. In order to convert our values to positive numbers, or to show an actual representation of our terrain, 18.4 cm were added to each height value. 18.4 cm needed to be added to each height because it was the height of the sandbox. The table below (table 1) show the results of the conversion.
 |
| Table 1. This table is showing each height that was recorded for each grid. Negative values represent features that went below the base of the sandbox. |
Discussion:
The surveying method we chose was fairly efficient and and allowed for the amount of error to be minimized. There may have been a quicker method to measure the heights, but creating a grid allowed for consistent and accurate data to be collected. I believe that the model that we create will accurately reflect the terrain features that we created.
Conclusion:
The skills that were learned in this lab are applicable to real life situations. Critical thinking is a very important skill to have when presented with an ambiguous task. Having limited directions forced the students to collaborate with their group members to come up with an efficient way to complete the assignment.
No comments:
Post a Comment